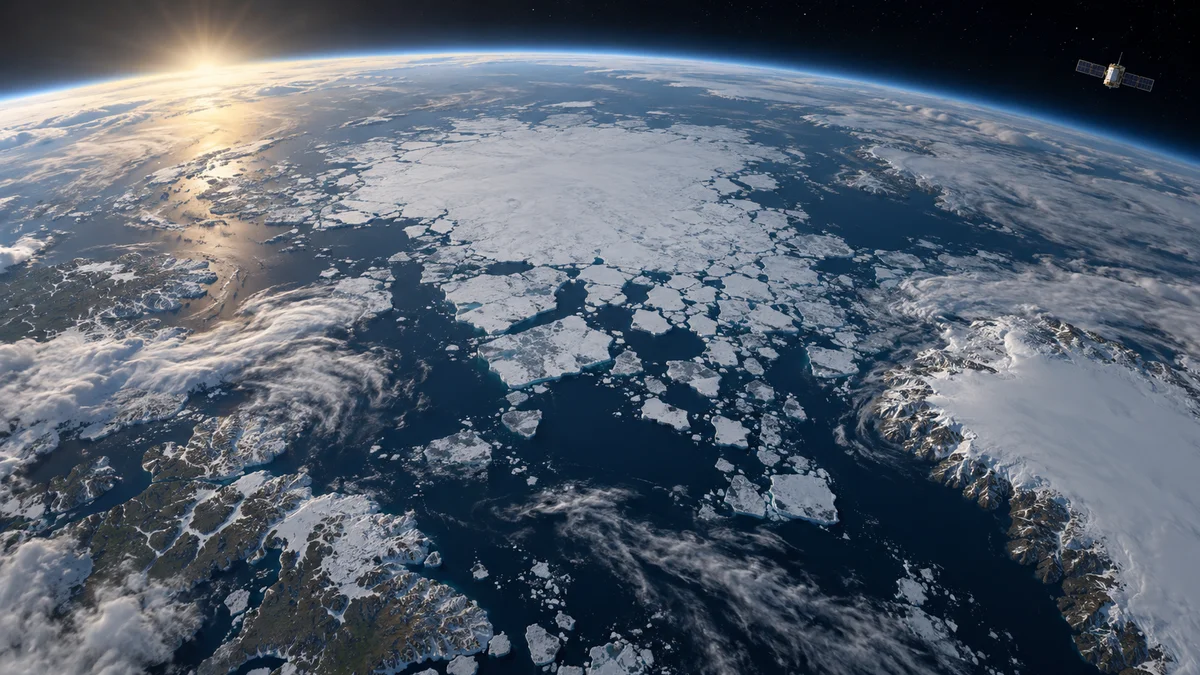
The Arctic’s 2026 summer sea-ice minimum was 4.6 million square kilometers, tying several previous years for the tenth-lowest minimum in the satellite record. That ranking describes one seasonal low; the more revealing picture comes from comparing it with the winter high and the longer record.
The key distinction is between a year’s position in the ranking and the direction of change across decades. NASA’s account gives readers a way to read both without treating a single September measurement as the whole story.
What does “minimum” mean for Arctic sea ice?
Sea ice grows across the Arctic Ocean during the polar winter, usually reaching its greatest extent in March. It then retreats through summer, typically reaching its annual minimum in September. The cycle itself is natural and has persisted for millennia.
In 2026, the minimum came on September 12. NASA and the National Snow and Ice Data Center estimated the ice extent at 4.6 million square kilometers, or 1.78 million square miles. That tied 2008, 2010 and 2025 for tenth-lowest in the satellite record.
| What to compare | What NASA reports | What it helps you understand | |---|---|---| | 2026 summer minimum | September 12; 4.6 million km² | The ice-covered extent at the seasonal low | | Position in the record | Tied for tenth-lowest | How this year ranks against the satellite era | | Lowest summer minimum | September 2012 | The record low is not the same as this year’s result | | Recent run of summers | Every summer from 2007 through 2026 ranks among the 20 lowest | The wider pattern behind an individual year | | 2026 winter maximum | March tied statistically with 2025 for the lowest maximum | The seasonal high is also part of the story |
Does tenth-lowest mean the decline has stopped?
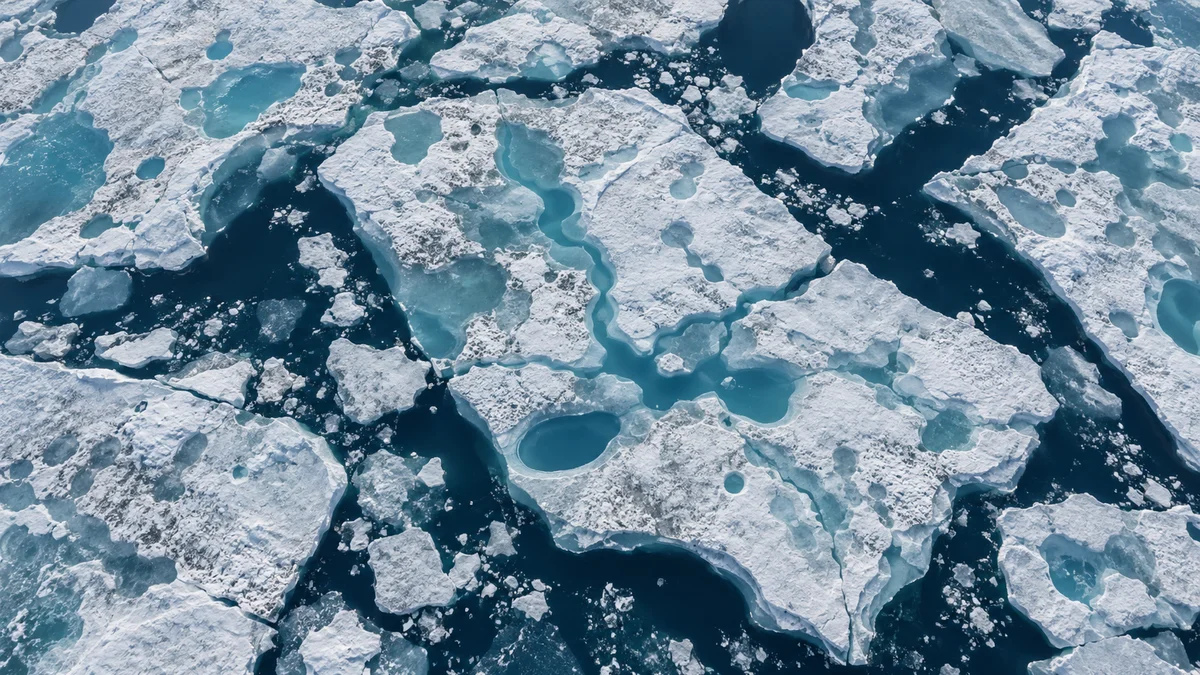
No. A ranking answers where this particular year falls; it does not, by itself, describe the full trend. NASA says satellite observations show less ice at both the annual maximum and minimum than a few decades ago. It also notes that the overall decline since the satellite record began steepened in the 2000s.
The recent summer minimum has been relatively steady, according to NASA. Weather can affect how much ice melts from one summer to another. The agency points to increased cloud cover over the past decade as one factor that prevented sunlight from accelerating melt. A less dramatic year-to-year change therefore does not erase the broader decline or establish that it has ended.
A useful reading habit is to hold two scales in view: the annual result and the multidecade record. The tenth-lowest tie gives the first; the repeated low rankings and long-term comparison provide the second.
Why look at the winter maximum too?
The annual minimum is only one end of the cycle. NASA reports that the March 2026 maximum statistically tied the 2025 maximum for the lowest in the satellite record. Looking at both ends helps avoid a narrow reading in which Arctic sea ice is considered only during its summer retreat.
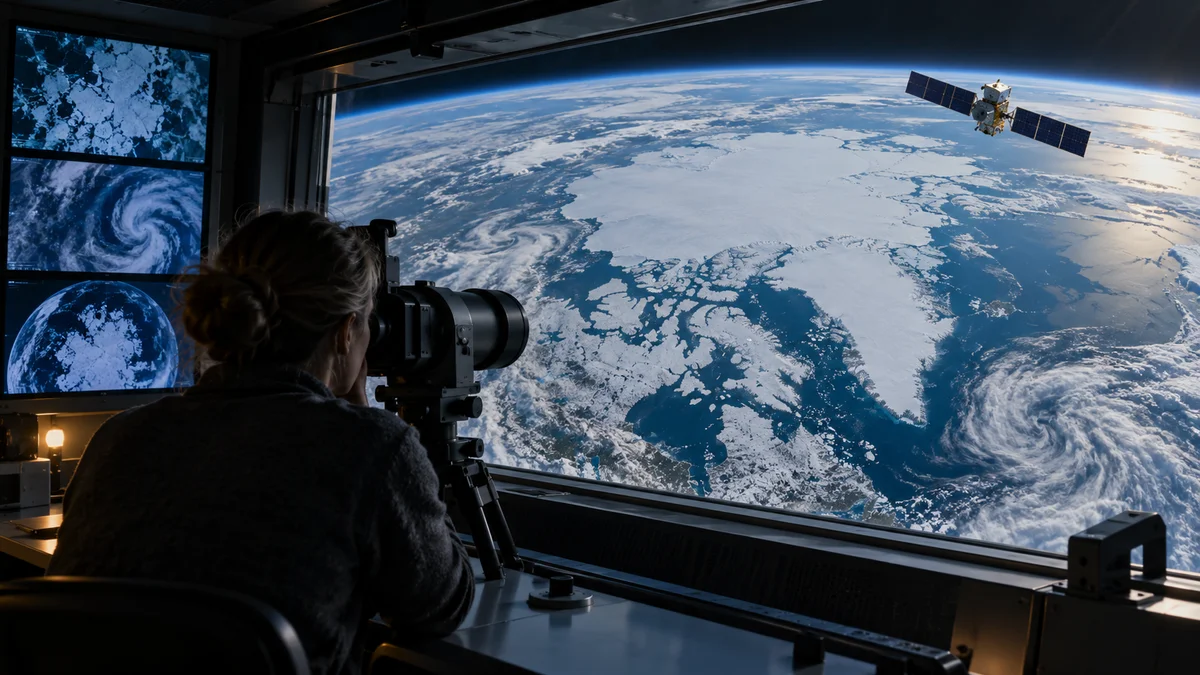
NASA’s account also describes a change in the kind of ice that remains. Multiyear ice—ice that survives at least one melt season—has declined, leaving the Arctic dominated by thinner first-year ice. That description adds context about the ice cover beyond the area measured at the September low.
How can satellites measure ice through clouds?
The record relies on passive microwave sensors. These instruments measure microwave energy naturally emitted by Earth. Sea ice emits more of this energy than open water, allowing the two to be distinguished in microwave observations. Because microwaves pass through clouds, satellites can observe the ice regularly in different weather conditions.
The satellite record began in 1978 with data from NASA’s Nimbus-7. Later observations came from other satellite programs, and scientists began using observations from Japan’s GCOM-W satellite in 2025. NASA notes one limitation in the maps: a central “pole hole,” where sensors historically could not collect data, is assumed to be ice-filled in the estimates.
What should you take away from the 2026 minimum?
The 2026 minimum is a useful snapshot, but its meaning comes from its context: a seasonal cycle, a low-ranking run of recent summers, changes in ice age and thickness, and a separate winter record. NASA says natural variability plays a role, but it cannot alone explain the decline seen throughout the satellite record; natural variability and rising global temperatures have worked together to melt more Arctic sea ice.
For a closer look, compare NASA’s September and March maps across the years shown in its Arctic sea-ice record. Follow the seasonal outline first, then check how each year sits against the longer series.